How a Golf Simulator Can Lower Your Scores
If you are looking to lower your scores, I’ve recently used a golf simulator to shave a few strokes off my typical score. I was able to take my handicap from a 7 to a 4 by creating a very precise Printable Golf Club Distance Chart. Below is a bit of a story on how and why I did it. I also give you a free Printable Golf Club Distance Chart to download.
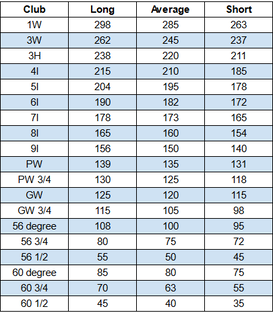
I recently got a new set of irons and wanted to see how far I hit each one. I decided to do a couple different sessions on a golf simulator and track the results. Over a few different sessions I hit each one of my irons 10 to 12 times and tracked the distance of each shot in a Printable Golf Club Distance Chart I made in a spreadsheet. When I analyzed my shot data, the results surprised me…
That last point seems to be fairly common. According to Shot Scope’s database that has tracked nearly 20 million shots, 80% of golfers are missing their greens on the short side.
After seeing the data, I did a few things:
Here is how I did it. First I made a Printable Golf Club Distance Chart in Excel to track the distances of each club. I put room to track 12 good swings with each club. I quickly realized that hitting 12 shots per golf club plus warm-up in a single session would probably not give me the best results. I decided to do two separate sessions of 6 shots with each club. If the shot was a huge outlier (say a massive chunk), I excluded it from my data. I recorded each reasonable (not perfect) shot in the spreadsheet and repeated the process through two different hitting sessions until I had 12 representative golf shots with each club. I also threw in some ½ and ¾ swing shots with my wedges and am super glad I did. I now have some great references on my Printable Golf Club Distance Chart for those in between yardages where you can really lower your score. Then I got nerdy. . . I took the golf simulator data from the 12 golf swings and created a table that showed the Long, Average, and Short distance for each golf club. The Long was an average of my 3 longest shots, and the Short was the average of my 3 shortest shots on the simulator. The average is across all 12. So now my Printable Golf Club Distance Chart includes my average, short, and long distance with each club - including ½ and ¾ swings on all my wedges. This is where a good bit of my scoring improved. With much shorter approach puts, I make more puts and have fewer 3 puts in a round.
This is where it gets really helpful. When picking a club I find my distance with a GPS Device or a Laser Rangefinder and go to the club with the closest average. I then look at my Printable Golf Club Distance Chart to see if the pin is in front, middle, or back position.
If the flag is in the back of the green, I make sure the “Long” distance with that club won’t get me in trouble. If it might, I look on my Printable Golf Club Distance Chart at the average distance of the next shorter club and see if the “Short” distance would get me in trouble. I am essentially looking at the two clubs to see which has less risk. Knowing my full range of tendencies has enabled me to avoid a blowup hole or two every other round or so. If the flag is in front, I go up one golf club and check for the same risks. If the pin is in the middle, I really just look to see if the short and long would stay on the green so I know if I should go after it, hit more of a stock shot or choke down on the club a tad. I hope this helps you find ways to use your golf simulator to improve. Here is my Printable Golf Club Distance Chart Now it is your turn. What do you think? How else could I improve this process? How do you use your golf simulator to train?
0 Comments
Your comment will be posted after it is approved.
Leave a Reply. |
|


 RSS Feed


